What Is the Sharpe Ratio?
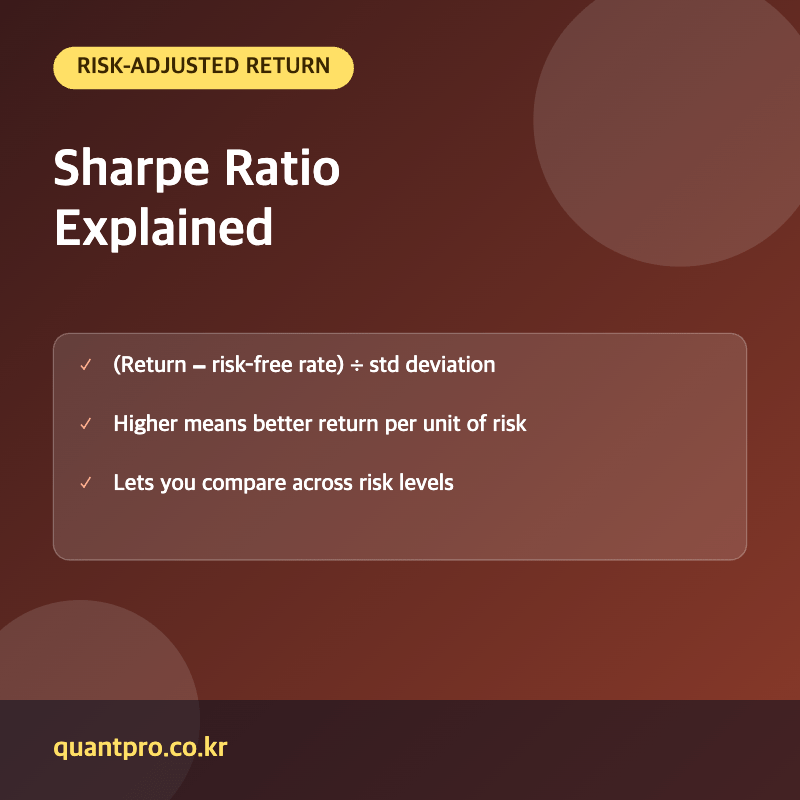
The Sharpe Ratio measures the risk-adjusted return of an investment, showing how much excess return an investor receives for each unit of risk taken. The formula is (Portfolio Return − Risk-Free Rate) ÷ Standard Deviation of Portfolio Returns, and a higher Sharpe Ratio indicates a more favorable risk-adjusted performance.
Developed by Nobel laureate William Sharpe, the ratio allows investors to compare investments with different levels of risk on an equal footing, rather than judging performance by raw returns alone, which can be misleading when comparing a high-risk investment to a low-risk one.
Why Risk-Adjusted Return Matters
Two portfolios can post identical raw returns while carrying very different levels of risk — the Sharpe Ratio reveals which portfolio achieved its return more efficiently, with less volatility along the way. A portfolio with a higher Sharpe Ratio delivered better returns relative to the risk investors had to endure to achieve them.
Limitations of the Sharpe Ratio
The Sharpe Ratio uses standard deviation as its risk measure, which treats upside and downside volatility equally — even large positive swings can lower the ratio, which may unfairly penalize investments with strong upside potential. It also assumes returns are normally distributed, which doesn’t always hold true for investments with skewed or fat-tailed return patterns.
| Sharpe Ratio Range | General Interpretation | Investor Takeaway |
|---|---|---|
| Below 1.0 | Suboptimal risk-adjusted return | Returns may not adequately compensate for risk taken |
| 1.0 to 2.0 | Good risk-adjusted return | Reasonable balance between return and volatility |
| Above 2.0 | Excellent risk-adjusted return | Strong returns relative to volatility, though rare and worth scrutinizing |
Frequently Asked Questions
Is a higher Sharpe Ratio always better?
Generally yes for comparing risk-adjusted performance, but an unusually high Sharpe Ratio should prompt closer scrutiny of the underlying data, since it could reflect a short measurement period, unusual market conditions, or non-normal return distributions.
What risk-free rate is typically used in the Sharpe Ratio?
Short-term government securities, such as U.S. Treasury bills, are commonly used as the risk-free rate benchmark, since they are considered to carry effectively no default risk over short time horizons.
How is the Sharpe Ratio different from the Sortino Ratio?
The Sortino Ratio is a variation that only penalizes downside volatility, ignoring upside swings, making it a preferred alternative for investors who feel the Sharpe Ratio unfairly punishes investments with large positive returns.
Can the Sharpe Ratio be used to compare different asset classes?
Yes, the Sharpe Ratio’s standardized approach allows for comparisons across different asset classes, such as stocks, bonds, or hedge funds, though comparisons are most meaningful when the return data covers a similar and sufficiently long time period.
Key Takeaways
The Sharpe Ratio measures how much excess return an investment generates per unit of risk taken, enabling fairer comparisons across investments with different volatility levels, though its reliance on standard deviation means it should be interpreted alongside other risk measures. This article is for informational purposes only and does not constitute investment advice.

QuantPro: AI Finds the Trade Before You Do
From AI-powered chart analysis to real-time market intelligence — everything a serious investor needs, in one platform.
- Automated AI chart analysis with precision trend timing
- Bull Radar: real-time visualization of geopolitical & economic shifts
- Live market-moving news and insights, curated for you

Bull Wave / Bear Wave Forecast Model
Engineered to help you read market direction and momentum faster than the crowd.
- Instantly separate bullish momentum from bearish pressure
- Pinpoint high-probability entry zones with confidence
- Chart signals clear enough for beginners, sharp enough for pros

Winning Pattern Detection
Instantly surfaces the high-probability setups that repeat across the charts — a trusted edge for timing your entries and exits.
- Spot momentum building in real time
- Catch trend-reversal points before they break
- Built for active traders who need results, not theory

AI Live Economic Dashboard
AI analyzes real-time market data — turning complex, global investment flows into clear insight in seconds.
- Track global stock markets in real time
- See exactly which assets are strong — and which are fading
- Watch how geopolitical events move the markets
About the Author