What Is the Treynor Ratio?
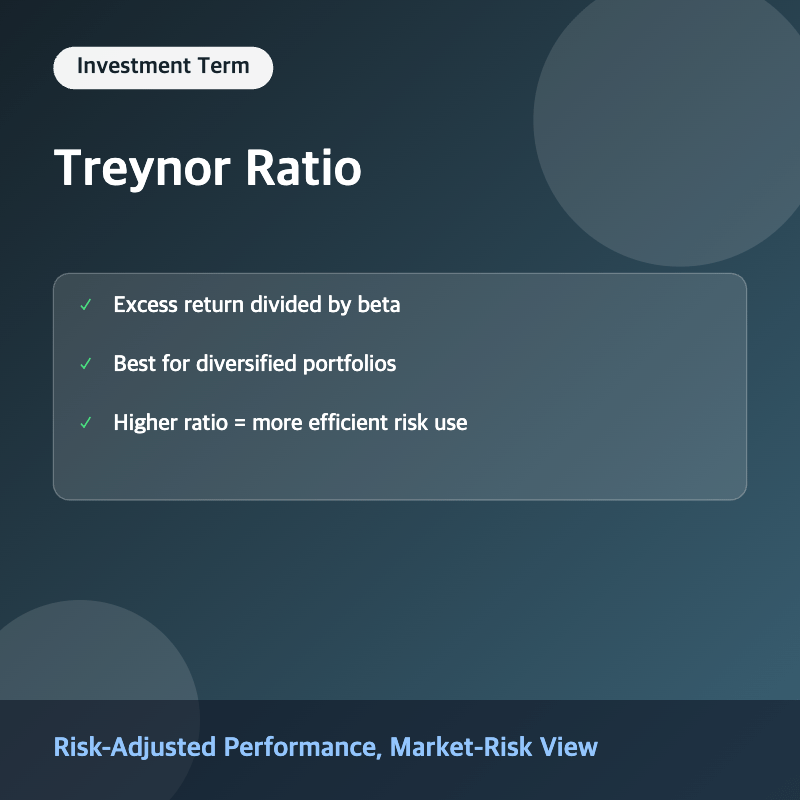
The Treynor Ratio, developed by economist Jack Treynor in the 1960s, is a risk-adjusted performance measure that evaluates how much excess return a portfolio or investment generated per unit of systematic risk, as measured by beta. Unlike some other risk-adjusted metrics that use total volatility, the Treynor Ratio focuses specifically on market risk, making it particularly useful for evaluating diversified portfolios where unsystematic (company-specific) risk has largely been eliminated.
How to Calculate the Treynor Ratio
The Treynor Ratio Formula
The Treynor Ratio formula is: Treynor Ratio = (Portfolio Return − Risk-Free Rate) ÷ Portfolio Beta. The numerator represents the excess return earned above the risk-free rate, while the denominator, beta, represents the portfolio’s sensitivity to overall market movements.
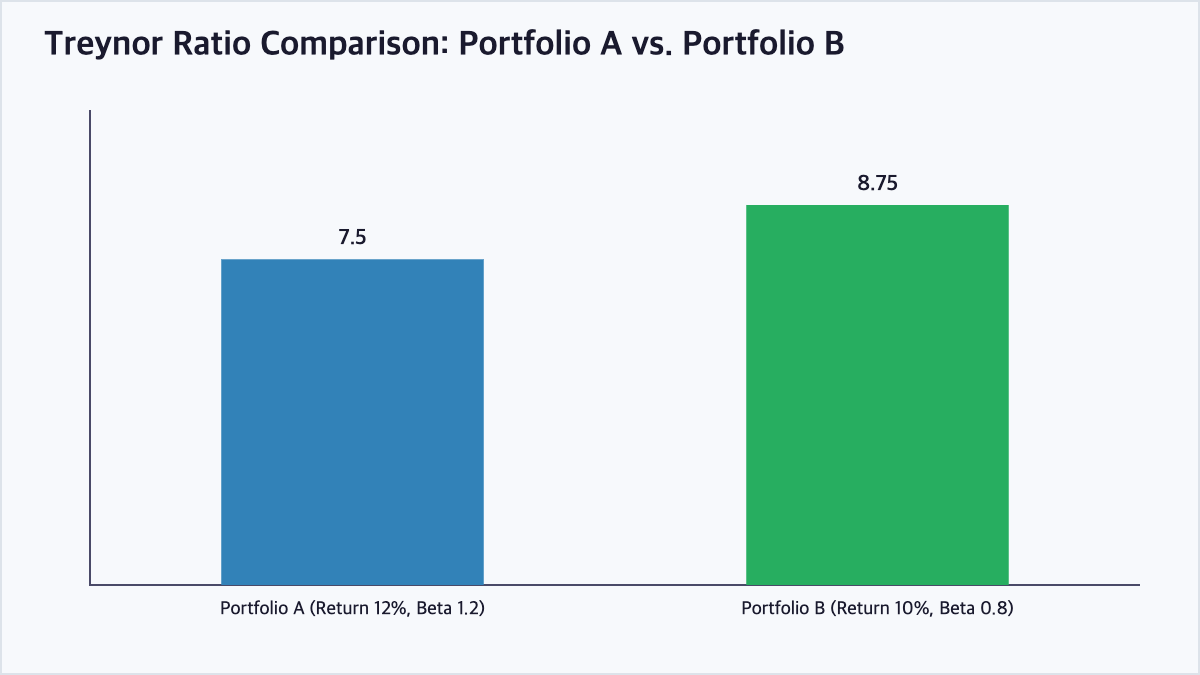
For example, suppose Portfolio A generated an annual return of 12%, the risk-free rate was 3%, and the portfolio’s beta is 1.2. The Treynor Ratio would be calculated as (12% − 3%) ÷ 1.2 = 9% ÷ 1.2 = 7.5. Now suppose Portfolio B produced a lower raw return of 10% but with a lower beta of 0.8. Its Treynor Ratio would be (10% − 3%) ÷ 0.8 = 7% ÷ 0.8 = 8.75. Despite the lower raw return, Portfolio B achieved a higher Treynor Ratio, indicating it generated more excess return per unit of market risk than Portfolio A.
Treynor Ratio vs. Sharpe Ratio
While both the Treynor Ratio and Sharpe Ratio measure risk-adjusted return, the Treynor Ratio uses beta (systematic/market risk) in the denominator, while the Sharpe Ratio uses standard deviation (total risk, including both systematic and unsystematic risk). This makes the Treynor Ratio more appropriate for well-diversified portfolios, where unsystematic risk has largely been diversified away, while the Sharpe Ratio may be more suitable for evaluating individual securities or less-diversified portfolios.
Limitations of the Treynor Ratio
A key limitation of the Treynor Ratio is that it relies on beta, a historical measure that may not accurately predict future volatility and can vary depending on the benchmark and time period used in its calculation. Additionally, the Treynor Ratio is only meaningful when comparing portfolios with positive beta values, as the interpretation becomes unreliable or misleading when beta is negative or close to zero.
Treynor Ratio vs. Sharpe Ratio Comparison
| Aspect | Treynor Ratio | Sharpe Ratio |
|---|---|---|
| Risk Measure Used | Beta (systematic risk) | Standard deviation (total risk) |
| Best Suited For | Well-diversified portfolios | Individual securities or less-diversified portfolios |
| Formula | (Return − Risk-Free Rate) ÷ Beta | (Return − Risk-Free Rate) ÷ Standard Deviation |
Frequently Asked Questions
What does a higher Treynor Ratio indicate?
A higher Treynor Ratio indicates that a portfolio or investment generated more excess return per unit of systematic (market) risk taken, suggesting more efficient use of market risk exposure. It is most useful when comparing multiple portfolios or funds against each other rather than viewing it in isolation.
Can the Treynor Ratio be negative?
Yes, the Treynor Ratio can be negative if a portfolio’s return falls below the risk-free rate, indicating the investment failed to compensate investors adequately for the risk-free alternative. A negative Treynor Ratio combined with a negative beta can also produce misleading results that require careful interpretation.
Why is the Treynor Ratio better suited for diversified portfolios?
Because the Treynor Ratio only accounts for systematic (market) risk via beta, it does not penalize a portfolio for unsystematic risk that has already been diversified away. For an undiversified portfolio still carrying significant company-specific risk, the Sharpe Ratio, which captures total risk, may provide a more complete picture.
How is beta determined for the Treynor Ratio calculation?
Beta is typically estimated through regression analysis comparing a portfolio’s historical returns against a relevant market benchmark, such as a broad stock market index, over a specified lookback period. Different data providers or time periods can produce somewhat different beta estimates for the same portfolio.
Key Takeaways
The Treynor Ratio measures excess return per unit of systematic (market) risk by dividing a portfolio’s excess return over the risk-free rate by its beta, making it especially useful for comparing well-diversified portfolios. Because it ignores unsystematic risk, it works best alongside other metrics like the Sharpe Ratio when evaluating less-diversified investments. This article is for informational purposes only and does not constitute investment advice.

QuantPro: AI Finds the Trade Before You Do
From AI-powered chart analysis to real-time market intelligence — everything a serious investor needs, in one platform.
- Automated AI chart analysis with precision trend timing
- Bull Radar: real-time visualization of geopolitical & economic shifts
- Live market-moving news and insights, curated for you

Bull Wave / Bear Wave Forecast Model
Engineered to help you read market direction and momentum faster than the crowd.
- Instantly separate bullish momentum from bearish pressure
- Pinpoint high-probability entry zones with confidence
- Chart signals clear enough for beginners, sharp enough for pros

Winning Pattern Detection
Instantly surfaces the high-probability setups that repeat across the charts — a trusted edge for timing your entries and exits.
- Spot momentum building in real time
- Catch trend-reversal points before they break
- Built for active traders who need results, not theory

AI Live Economic Dashboard
AI analyzes real-time market data — turning complex, global investment flows into clear insight in seconds.
- Track global stock markets in real time
- See exactly which assets are strong — and which are fading
- Watch how geopolitical events move the markets
About the Author